In previous posts, I have shown you how to execute Javascript in JVM using Nashorn & GraalJS. GraalJS performance variation across interpreted and compiled mode is also compared in the post here: Comparing performance of GraalJS interpreted vs compiled mode.
With Nashon not part of Java from version 14 onwards and GraalJS availability, let’s now compare the performance of Javascript execution in Nashorn against the GraalJS executing in interpreted mode. I have used the same benchmark program and ran the comparison in laptop running AMD Ryzen 5 2500U (8 CPU) using GraalVM (version 21) with single thread. Here are the results.
Nashorn
Average time, Latency
| Iteration | Forked VM 1 | Forked VM 2 |
| 1 | 73.242 | 73.475 |
| 2 | 62.904 | 62.604 |
| 3 | 60.457 | 60.415 |
| 4 | 57.174 | 58.324 |
| 5 | 54.917 | 53.681 |
| 6 | 52.365 | 55.873 |
| 7 | 55.104 | 54.938 |
| 8 | 53.563 | 53.134 |
| 9 | 53.719 | 55.183 |
| 10 | 52.249 | 51.822 |

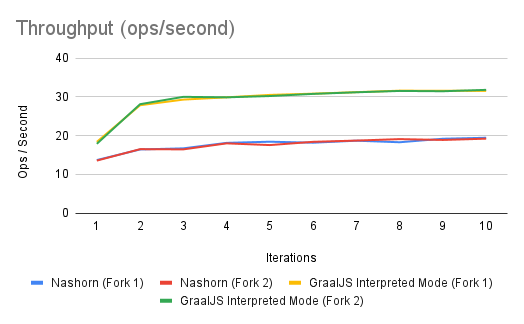
Throughput
| Iteration | Forked VM 1 | Forked VM 2 |
| 1 | 13.664 | 13.52 |
| 2 | 16.397 | 16.474 |
| 3 | 16.685 | 16.42 |
| 4 | 18.099 | 17.971 |
| 5 | 18.399 | 17.529 |
| 6 | 18.14 | 18.369 |
| 7 | 18.661 | 18.689 |
| 8 | 18.257 | 19.069 |
| 9 | 19.163 | 18.85 |
| 10 | 19.418 | 19.182 |

Comparison
| Average Time (ms/op) | Minimum | Average | Maximum |
|---|---|---|---|
| GraalJS Interpreted | 32.345 | 32.808 | 33.498 |
| Nashorn | 51.822 | 53.795 | 55.873 |

| Throughput (Ops/Sec) | Minimum | Average | Maximum |
|---|---|---|---|
| GraalJS Interpreted | 30.738 | 31.321 | 31.779 |
| Nashorn | 18.140 | 18.780 | 19.418 |

The performance of GraalJS in interpreted mode is 1.5 times better than Nashorn. But performance results are based on multiple factors, and we know that the benchmark program used is CPU-bound. and this may not reflect the characteristics of our real-world applications. Having known that the Nashorn is not anymore officially part of Java delivery and GraalJS is providing better performance, engineering management have to do the trade-off decision before investing in migration from Nashorn to GraalJS.
Stay tuned.